
Vegan Food Market: Statistics, Trends, and Forecasts to 2035
Quick Answer
Global plant-based food sales reached approximately $28.6 billion in 2024, with multiple forecasts pointing to $40–$100+ billion by the early 2030s and plant-based products overperforming in ecommerce.
- Global retail sales of plant-based foods (meat, seafood, dairy alternatives, and other categories) reached $28.6 billion in 2024, a 5% increase vs 2023, according to analysis of The Good Food Institute’s State of the Industry data by The Food Institute and Green Queen.
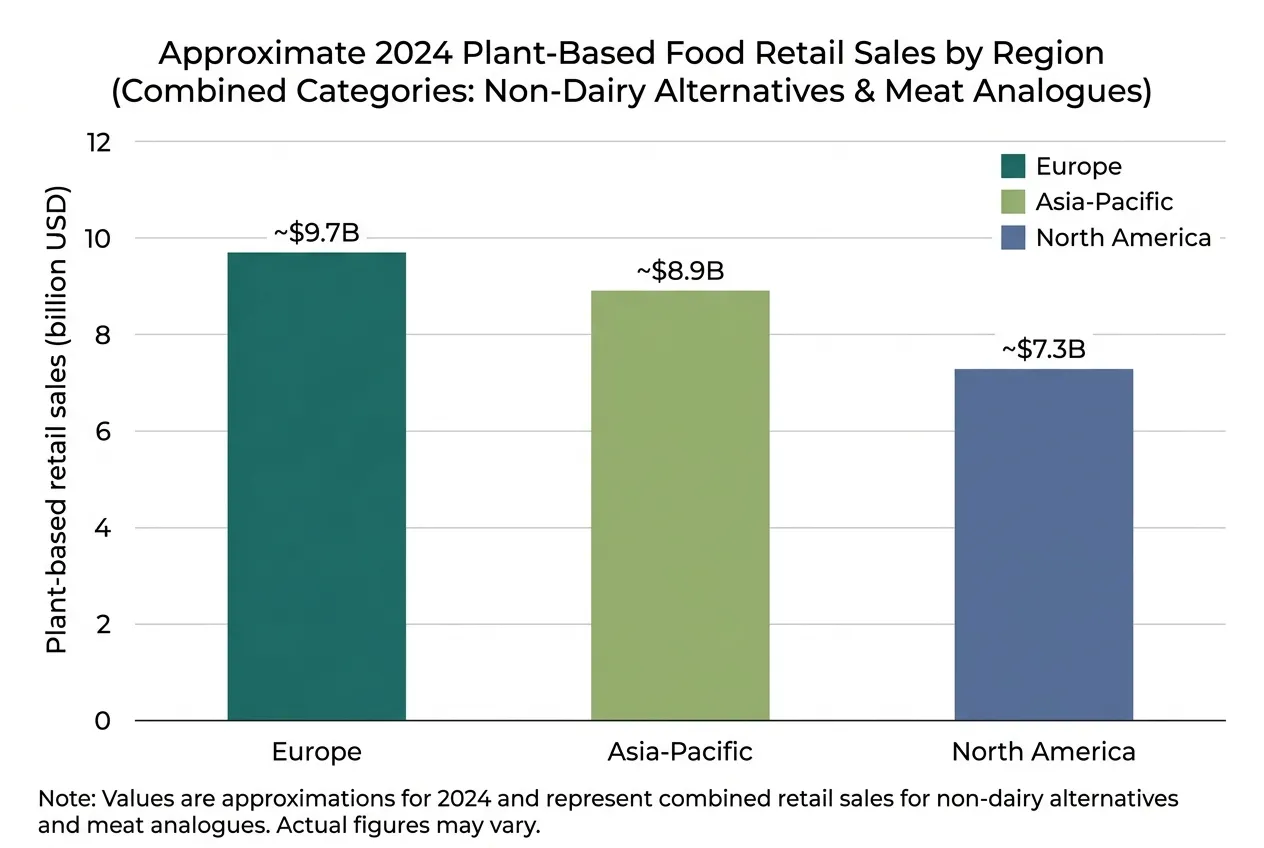
- In 2024, non-dairy alternatives accounted for $22.4 billion, while plant-based meat analogues reached $6.1 billion, with regional sales of roughly $9.7 billion in Europe, $8.9 billion in Asia-Pacific, and $7.3 billion in North America, based on GFI’s Euromonitor data as reported by Green Queen.
- Global vegan food market forecasts include $39.8–$42.1 billion by 2032–2033 at 8.66–9.03% CAGR (IMARC Group), $46.09 billion by 2033 at 9.6% CAGR (Research and Markets), and $109.4 billion by 2032 at 12.4% CAGR (Meticulous Research), with additional projections from SkyQuest and Straits Research.
- In the United States, plant-based foods generated around $8.1 billion in retail sales in 2023, with $394 million in ecommerce sales, and achieved 6.8% share of online food sales vs 3.8% in brick-and-mortar grocery, based on data from the Plant Based Foods Association (PBFA) Marketplace and NielsenIQ.
Global vegan food market forecasts
Published forecasts indicate high-single-digit to low-double-digit annual growth through the early 2030s, but projected market values vary substantially by publisher.
| Market segment | Base-year value | Projected value | Forecast period | CAGR | Named source |
|---|---|---|---|---|---|
| Vegan food | $18.3 billion to $19.9 billion, 2023 to 2024 | $39.8 billion to $42.1 billion | 2032 to 2033 | 8.66% to 9.03% | IMARC Group |
| Vegan food | $20.06 billion, 2024 | $46.09 billion, 2033 | 2024 to 2033 | 9.6% | Research and Markets |
| Vegan food | $42.6 billion, 2024 | $109.4 billion, 2032 | 2025 to 2032 | 12.4% | Meticulous Research |
| Plant-based food | $10.7 billion, 2024 | $28.51 billion, 2033 | 2026 to 2033 | 10.2% | SkyQuest |
| Vegan food | $30.67 billion, 2026 | $71.7 billion, 2034 | 2026 to 2034 | 11.2% | Straits Research |
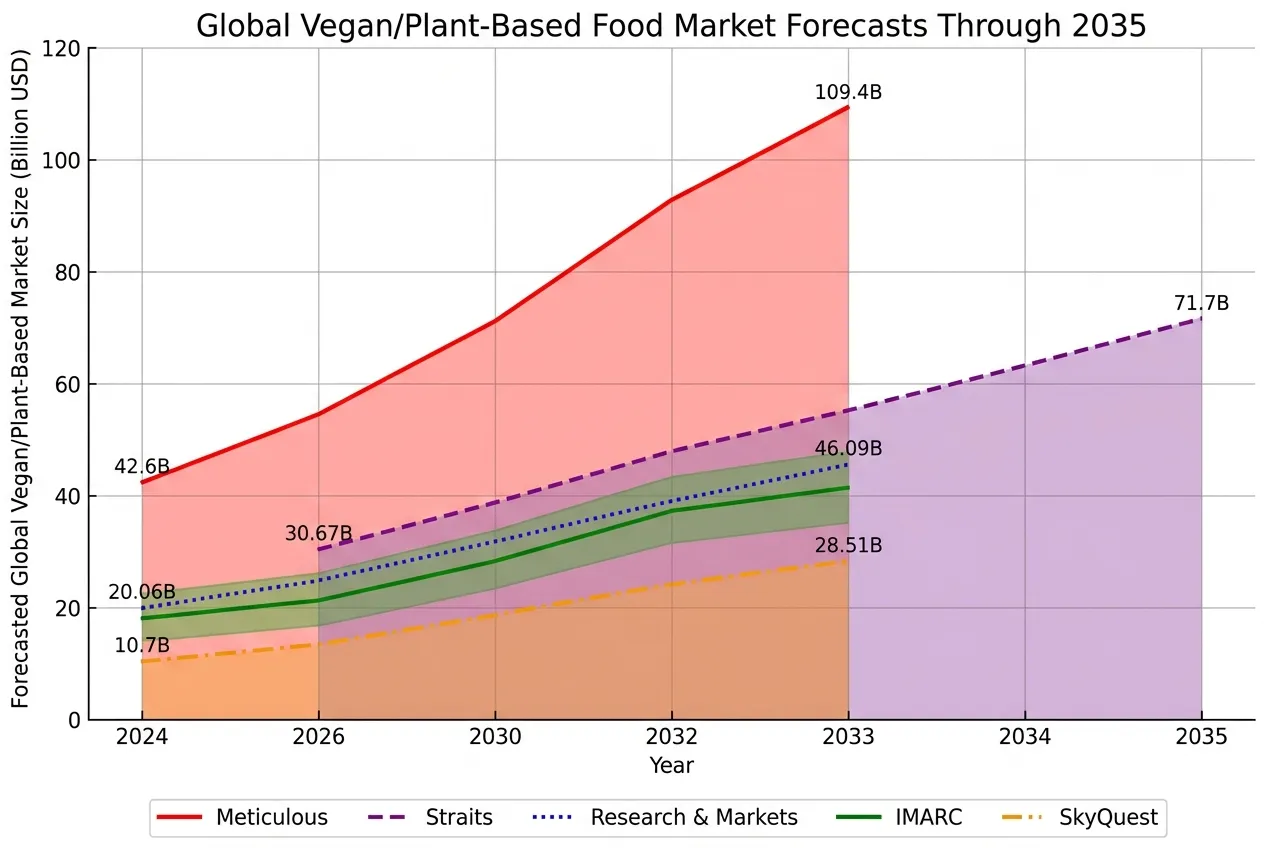
$46.09 billion, projected global vegan food market value in 2033, according to Research and Markets.
The IMARC Group forecast places projected growth in the 8.66% to 9.03% CAGR range. Meticulous Research reports a higher projected CAGR of 12.4%, while Straits Research projects a 11.2% CAGR through 2034.
The Good Food Institute reports that the global plant-based food industry has grown at approximately 15% CAGR since 2019. Its modelling indicates that plant-based meat would require approximately 25% CAGR from 2023 onward to reach the low end of some external 2035 forecasts.
Market forecasts should not be combined into a single average. Differences in product coverage, channel inclusion, geographic scope, currency conversion and forecast methodology can produce materially different results.
Regional Markets and Country-Level Penetration
Asia-Pacific leads global plant-based milk sales, while Europe and North America remain major markets for plant-based meat, seafood, cheese, yogurt and ice cream.
More than two times, the approximate difference between Asia-Pacific and North American plant-based milk sales, according to The Good Food Institute, citing Euromonitor data.
Regional category patterns reported by The Good Food Institute include:
- Asia-Pacific is the leading region for plant-based milk sales, supported by traditional soy and plant-based beverages and newer alternative-milk products.
- Europe and North America are major regions for plant-based meat, seafood, cheese and ice cream.
- Europe is particularly strong in plant-based yogurt.
- European plant-based food companies raised approximately $584 million in 2023, an increase of 74% from 2022, according to The Good Food Institute.
Vegan diet prevalence by country
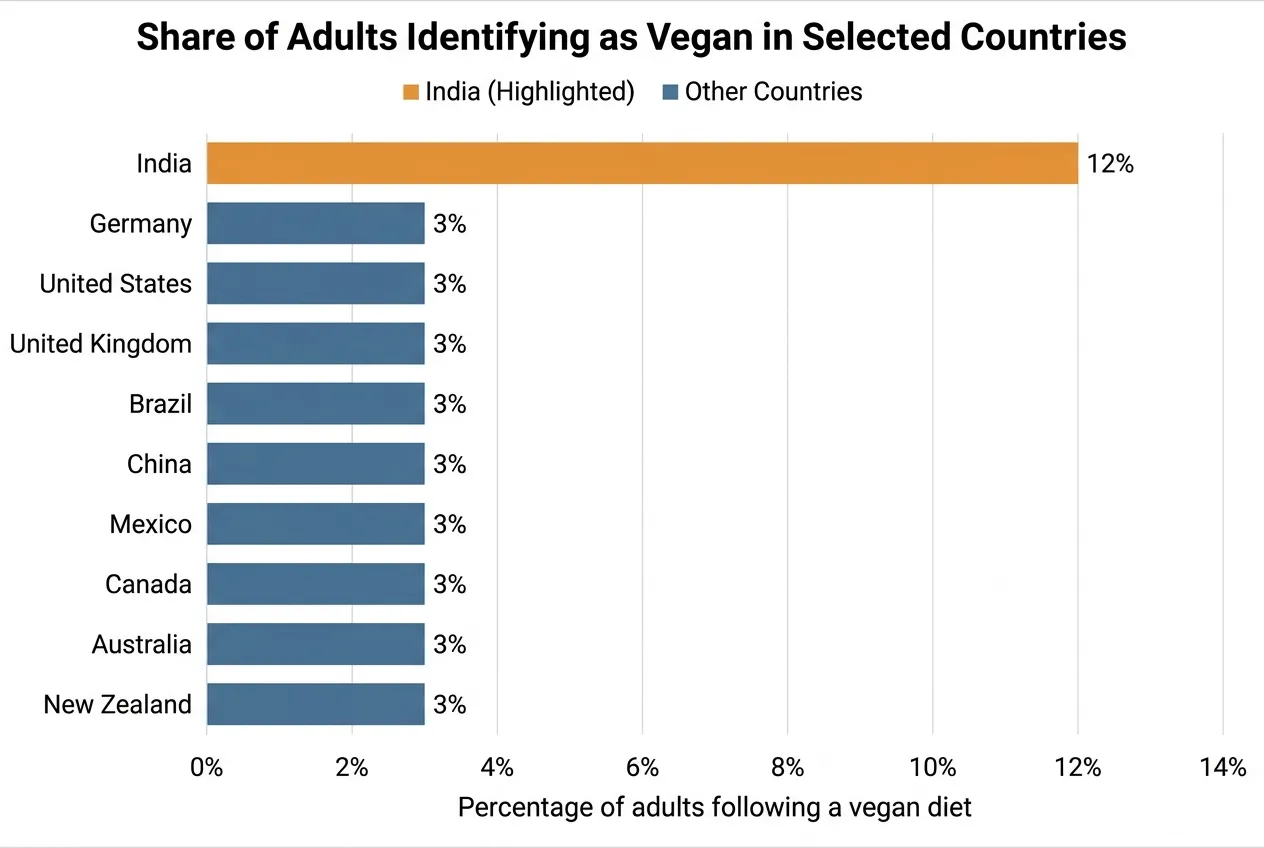
Self-reported vegan diet prevalence is generally between 2% and 4% across many major Western markets, while India reports the highest range in the supplied country data.
| Country | Adults following a vegan diet | Survey or reporting period | Named source |
|---|---|---|---|
| India | Approximately 10% to 14% | 2024 to 2025 | Statista Consumer Insights and Green Queen |
| Germany | Approximately 4% | 2024 | Statista Consumer Insights |
| Brazil | Approximately 2% to 4% | 2024 | Statista Consumer Insights |
| China | Approximately 2% to 4% | 2024 | Statista Consumer Insights |
| Mexico | Approximately 2% to 4% | 2024 | Statista Consumer Insights |
| United States | Approximately 2% to 4% | 2024 to 2025 | Statista Consumer Insights and Green Queen |
| United Kingdom | Approximately 2% to 4% | 2024 | Statista Consumer Insights |
| Canada | Approximately 3% | 2025 to 2026 | Green Queen |
| Australia | Approximately 3% | 2025 to 2026 | Green Queen |
| New Zealand | Approximately 3% | 2025 to 2026 | Green Queen |
These figures measure self-reported vegan diet identity. They do not measure total plant-based product purchases, flexitarian behaviour or plant-forward diets.
European plant-based product penetration
Household purchasing of plant-based products is substantially broader than self-identification as vegan in the European markets covered by the Circana data.
| Country | Households buying plant-based meat at least once | Households buying plant-based milk at least once | Plant-based milk share of total milk sales | Named source |
|---|---|---|---|---|
| Germany | 37% | More than one-third | 9.8% | GFI Europe |
| United Kingdom | 33% | More than one-third | Not specified | GFI Europe |
| Spain | 19% | Approximately 40% | Not specified | GFI Europe |
| France | Not specified | Not specified | 4.6% | GFI Europe |
| Italy | Not specified | Not specified | Between France and Germany | GFI Europe |
| Netherlands | Not specified | Not specified | Mid-single-digit range | GFI Europe |
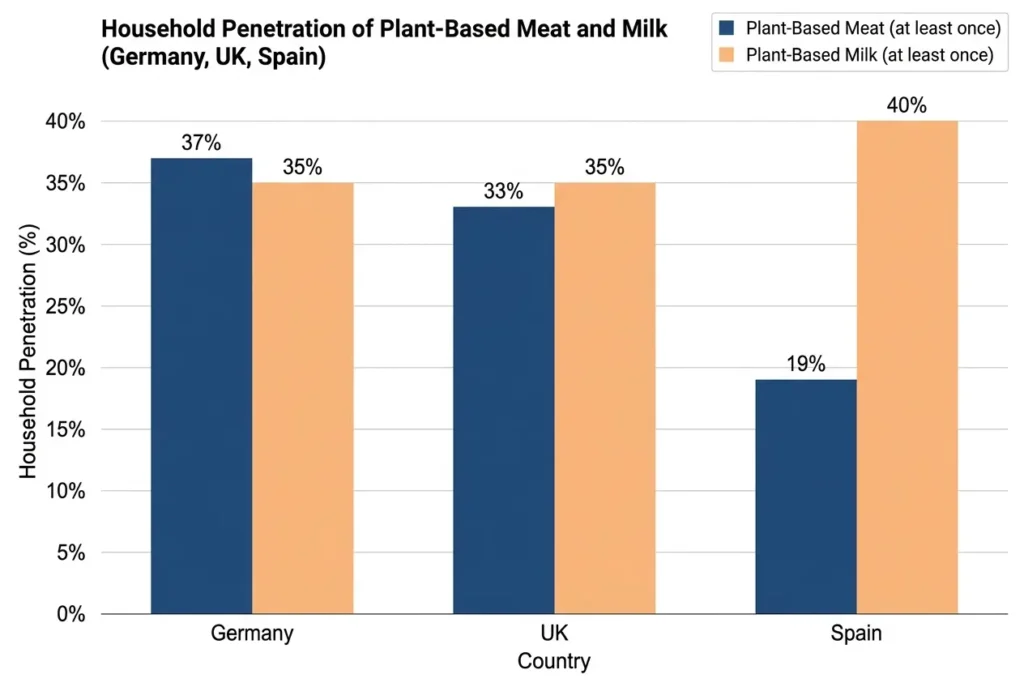
The reported sales year for these figures is 2023, according to GFI Europe’s analysis of Circana retail data.
9.8%, plant-based milk’s reported share of total milk sales in Germany in 2023, according to GFI Europe.
Consumer Adoption, Price Premiums and Market Barriers
U.S. plant-based food purchasing is widespread, but plant-based meat sales are concentrated among a relatively small group of highly engaged households.
7% of U.S. households accounted for 82% of plant-based meat dollar sales in 2022, according to household-level analysis from The Good Food Institute.
Additional U.S. household metrics from The Good Food Institute include:
- 60% of U.S. households purchased plant-based foods in 2023.
- 81% of those purchasing households bought plant-based foods more than once during 2023.
- 15% of households purchased plant-based meat and seafood in 2023.
- Plant-based meat household penetration declined from 19% in 2022 to 15% in 2023.
- 21% of households purchased both conventional and plant-based meat in 2022.
- 0.5% purchased plant-based meat only in 2022.
- 79% purchased conventional meat only in 2022.
- The top-spending third of blended households allocated 33% of their meat budget to plant-based meat.
- Medium-engaged households allocated 7% of their meat budget to plant-based meat.
- Low-engaged households allocated 2% of their meat budget to plant-based meat.
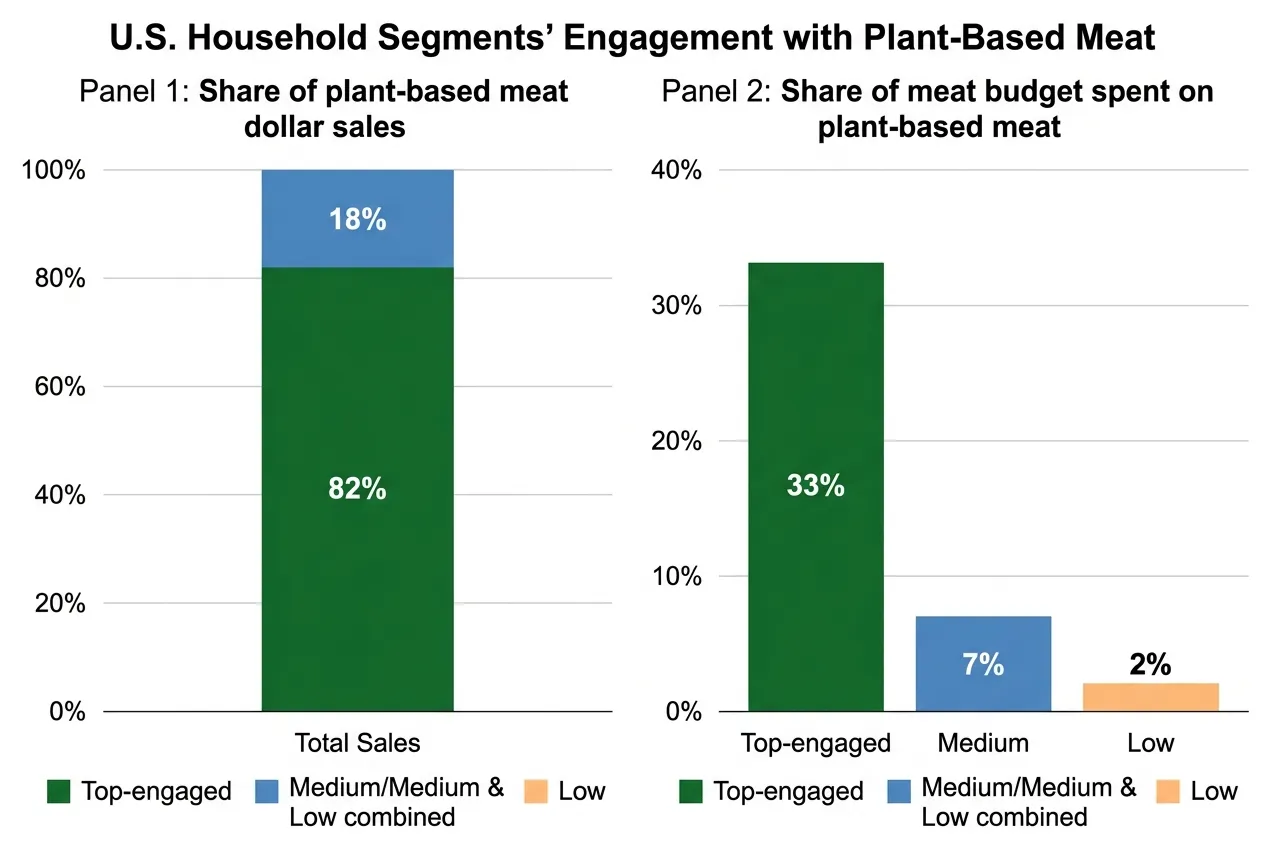
The Good Food Institute estimates that the category could be approximately 70% larger in dollar terms if medium-engaged households increased their purchasing to the level of the top-engaged group. This is a modelled scenario, not an observed sales result.
Consumption frequency and motivations
Trial does not consistently translate into frequent repeat consumption, with taste, texture, price and familiarity remaining measurable barriers.
| Consumer metric among people who tried plant-based meat | Share | Named source |
|---|---|---|
| Tried it only once | 33% | The Good Food Institute |
| Tried it a few times ever | 31% | The Good Food Institute |
| Consume it a few times per year | 11% | The Good Food Institute |
| Consume it at least monthly | 24% | The Good Food Institute |
Reported motivations among repeat users were:
| Motivation | Share | Named source |
|---|---|---|
| It is healthy | 37% | The Good Food Institute |
| It is a good source of protein | 21% | The Good Food Institute |
| They like the taste | 23% | The Good Food Institute |
| They like the texture | 19% | The Good Food Institute |
| It avoids animal harm | 19% | The Good Food Institute |
| It benefits the environment | 19% | The Good Food Institute |
Among people who tried plant-based meat only once, 51% reported disliking the taste, 44% preferred animal meat, 34% disliked the texture and 21% considered the product too expensive, according to The Good Food Institute.
Among people who had never tried plant-based meat, 35% preferred animal meat, 29% did not expect it to taste good and 21% considered it too expensive. Approximately 50% of U.S. adults reported being not too familiar or not at all familiar with plant-based meat, while four in ten reported never having tried it, according to The Good Food Institute.
Retail price premiums
Price parity remains a measurable barrier to mainstream adoption of plant-based meat, milk and egg products.
77%, the average 2023 retail price premium for plant-based meat and seafood compared with conventional meat, according to The Good Food Institute.
| Product category | Average plant-based retail price premium in 2023 | Named source |
|---|---|---|
| Plant-based meat and seafood | 77% | The Good Food Institute |
| Plant-based milk | 104% | The Good Food Institute |
| Plant-based eggs | 317% | The Good Food Institute |
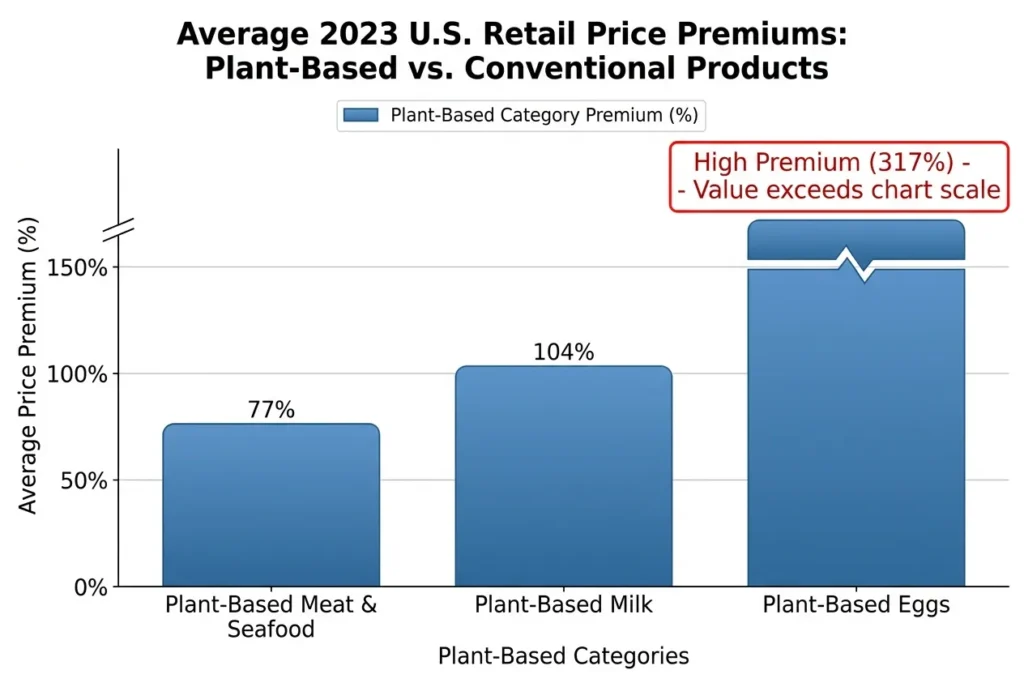
Price comparisons should identify the product types, pack sizes, retail channels and measurement period. Category averages do not predict the premium for an individual brand or stock-keeping unit.
Ecommerce, Search Demand and User Experience Benchmarks
Plant-based foods achieved a higher share of online food sales than brick-and-mortar grocery sales in the United States in 2023.
6.8%, plant-based foods’ share of online food sales in the United States in 2023, compared with 3.8% in brick-and-mortar grocery, according to PBFA marketplace data, and NielsenIQ.
| Digital commerce metric | Reported figure | Named source |
|---|---|---|
| U.S. plant-based ecommerce sales in 2023 | $394 million | Plant Based Foods Association, NielsenIQ |
| Plant-based ecommerce CAGR, 2020 to 2023 | 16.4% | Plant Based Foods Association, NielsenIQ |
| Plant-based share of online food sales | 6.8% | Plant Based Foods Association, NielsenIQ |
| Plant-based share of brick-and-mortar grocery sales | 3.8% | Plant Based Foods Association, NielsenIQ |
| Total U.S. retail plant-based food sales in 2023 | $8.1 billion | Plant Based Foods Association, NielsenIQ |
| Cumulative U.S. retail dollar-sales growth, 2018 to 2023 | 79% | Plant Based Foods Association, NielsenIQ |
| Retailer website searches for plant-based products in 2022 | 691,000 | NielsenIQ |
| Consumers reporting a plant-based or plant-forward diet | 17% | NielsenIQ |
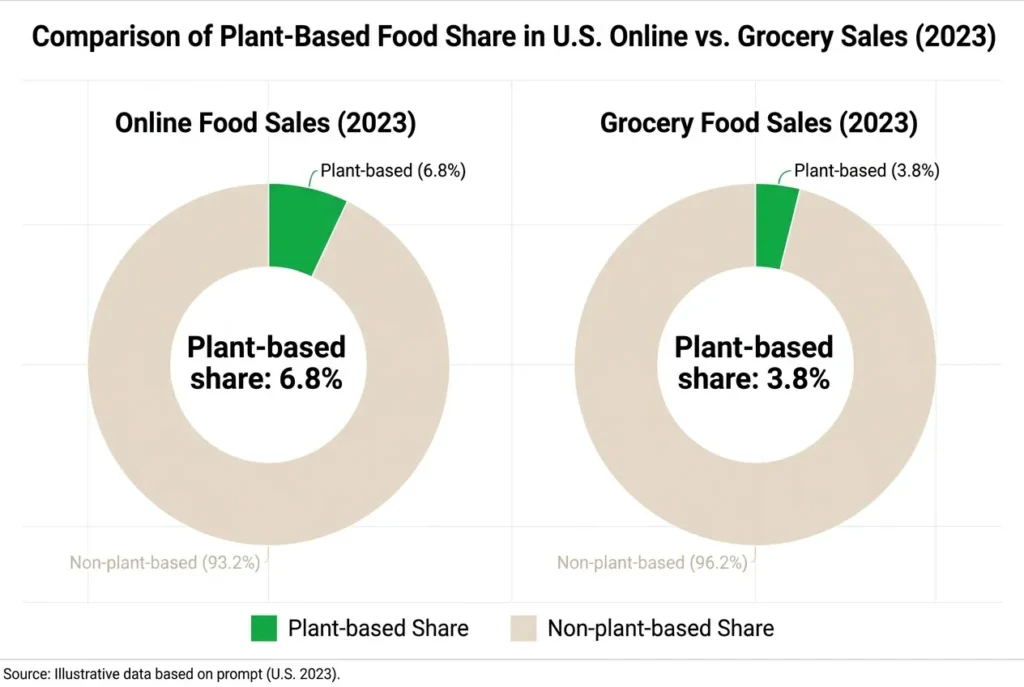
Online sales were particularly strong in categories including creamers, ready-to-drink beverages, protein powders and liquid products, according to the Plant Based Foods Association.
Social commerce and checkout performance
Digital demand does not remove conversion friction, with global cart abandonment remaining approximately 70%.
70.22%, the average global online shopping cart abandonment rate across 50 studies, according to the Baymard Institute.
| Ecommerce or social-commerce benchmark | Reported figure | Named source |
|---|---|---|
| Average global cart abandonment rate | 70.22% | Baymard Institute |
| Food and grocery abandonment rate | Often above 60% | Baymard Institute |
| Potential conversion improvement from checkout design | 35% | Baymard Institute |
| Estimated recoverable U.S. and EU orders | $260 billion | Baymard Institute |
| Consumers buying from brands they follow on social media | Nine in ten | Shopify |
| Expected online share of global retail sales by the end of 2023 | Approximately one in five | Shopify |
| Projected social-commerce value by the middle of the decade | More than $2 trillion | Shopify |
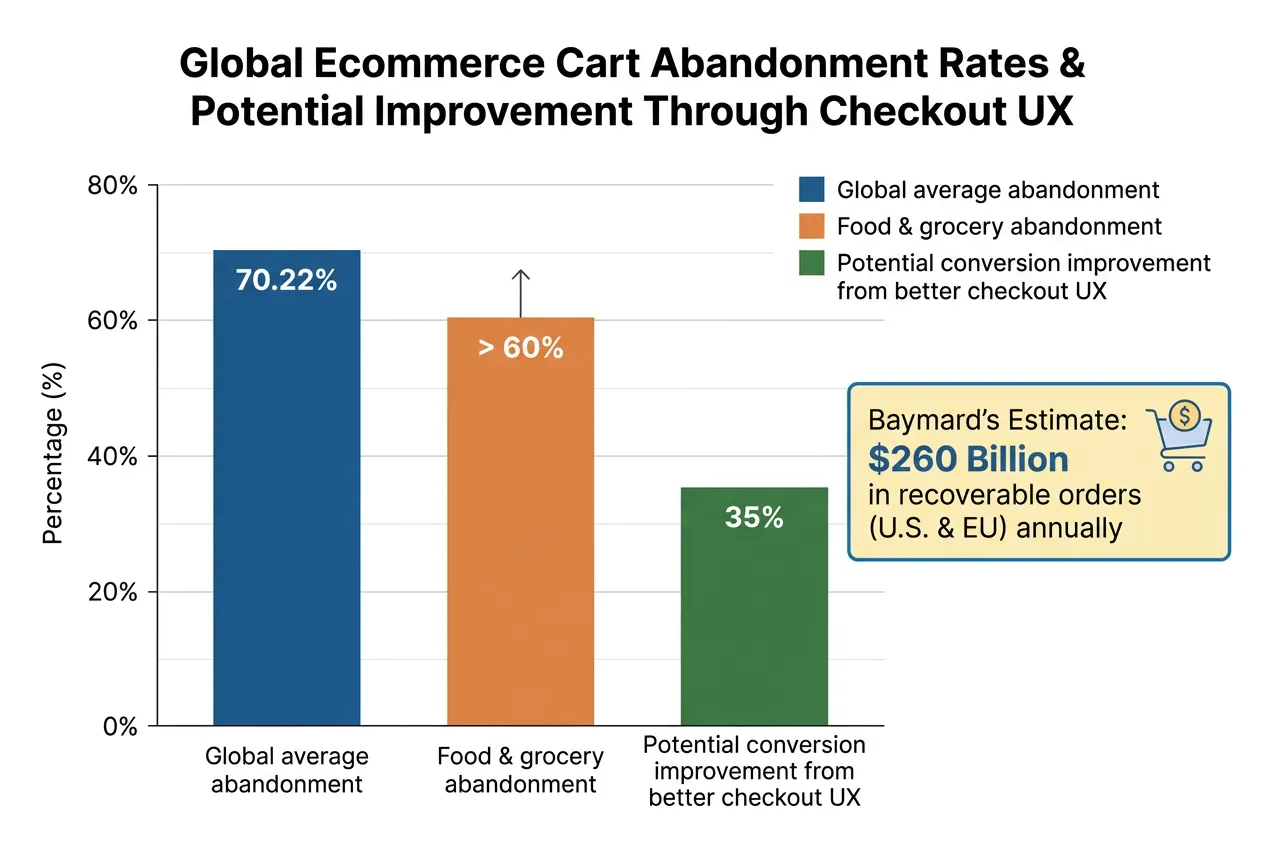
The Baymard Institute estimates that checkout improvements could raise average ecommerce conversion by 35% and identifies approximately $260 billion in potentially recoverable orders across the United States and European Union. These figures apply to ecommerce broadly, not specifically to vegan food retailers.
Digital merchandising considerations
| Market observation | Ecommerce response | Named source |
|---|---|---|
| Plant-based products hold a higher share online than in physical grocery | Create dedicated plant-based category pages and navigation paths | Plant Based Foods Association |
| Flexitarians are more likely to purchase plant-based meat than omnivores | Build separate flexitarian, vegetarian and vegan audience journeys | The Good Food Institute |
| Price is a reported adoption barrier | Display unit-price information, bundles, subscriptions and promotions | The Good Food Institute |
| Taste and texture influence repeat purchase | Use preparation guidance, reviews, comparisons and recipes | The Good Food Institute |
| Products may be hidden within conventional assortments | Use prominent category placement and clear vegan filters | The Good Food Institute |
| Checkout abandonment remains high across ecommerce | Simplify checkout and clarify shipping, delivery and payment details | Baymard Institute |
The supplied Good Food Institute analysis reports that 55% of flexitarians purchased plant-based meat during the previous year, compared with 28% of omnivores. This is a consumer-segment comparison, not a category-wide conversion rate.
Global Vegan and Plant-Based Food Market Size and Growth (2019–2024)
Global plant-based retail sales grew to approximately $28.6 billion in 2024, up 5% from 2023, with non-dairy alternatives driving most of the value.
Global sales of plant-based foods reached $28.6 billion in 2024, according to The Good Food Institute’s State of the Industry data as summarised by The Food Institute and Green Queen. Non-dairy alternatives accounted for roughly $22.4 billion of this total, while plant-based meat analogues reached around $6.1 billion, with regional sales estimated at $9.7 billion in Europe, $8.9 billion in Asia-Pacific, and $7.3 billion in North America.
Earlier GFI/Euromonitor data showed global plant-based retail sales at $21.6 billion in 2019 and $29 billion in 2023, highlighting strong multi-year growth even as category mix and regional performance evolve over time, as reported in the 2023 State of the Industry – Plant-based meat, seafood, eggs, and dairy.
| Category | Global retail sales in 2023 | Named source |
|---|---|---|
| Plant-based milk | $18.7 billion | The Good Food Institute, citing Euromonitor |
| Plant-based meat and seafood | $6.4 billion | The Good Food Institute, citing Euromonitor |
| Plant-based yogurt | $1.6 billion | The Good Food Institute, citing Euromonitor |
| Plant-based ice cream | $1.4 billion | The Good Food Institute, citing Euromonitor |
| Plant-based cheese | $896 million | The Good Food Institute, citing Euromonitor |
| Total listed categories | Approximately $29 billion | The Good Food Institute, citing Euromonitor |
The reported total increased from $21.6 billion in 2019 to $29 billion in 2023, an increase of approximately 34%. Global plant-based meat volume reached approximately 656,000 metric tons in 2023, compared with roughly 410 million metric tons of conventional meat, according to the same Good Food Institute industry analysis.
Data Limitations and Context
Market size, diet prevalence, household penetration, product market share and ecommerce performance measure different forms of adoption and should not be combined into a single market estimate.
- Market forecasts describe projected revenue under a publisher-specific definition of vegan or plant-based food.
- Diet prevalence measures self-identification, not purchasing frequency or retail value.
- Household penetration measures whether a household purchased a category during a stated period.
- Market share compares a product category with a defined total market, such as all milk sales.
- Survey responses describe reported attitudes or behaviour and may not equal observed sales.
- Retail sales, foodservice sales, ecommerce sales and household purchasing are separate measurements.
- Ranges reflect the precision available in the underlying source data and should not be converted into point estimates.
- Forecast values are not historical sales and should not be presented as observed market size.
Several sources use overlapping terminology. “Vegan food” may refer to products formulated without animal-derived ingredients, while “plant-based food” may include vegan products, vegetarian products and plant-forward alternatives. The precise inclusion of beverages, foodservice, supplements, private-label products and ecommerce varies by publisher.
The country prevalence figures measure dietary identity. The European penetration figures measure product purchasing, and therefore represent different consumer behaviours.
Methodology and Definitions
| Term | Definition |
|---|---|
| Vegan food market | A publisher-defined category of food products marketed as vegan |
| Plant-based food | A broader category that may include vegan, vegetarian and plant-forward products |
| Retail sales | Sales through retail channels, with ecommerce and foodservice inclusion confirmed separately |
| Household penetration | The percentage of households purchasing a category during a stated period |
| Market share | A category’s sales as a percentage of a defined total market |
| CAGR | Compound annual growth rate over a specified period |
| Vegan prevalence | The percentage of respondents self-identifying as vegan |
| Plant-forward diet | A dietary pattern with a high proportion of plant foods, not equivalent to veganism |
| Price premium | The percentage by which a plant-based product’s average price exceeds the comparison product |
| Ecommerce share | The percentage of online food sales represented by a defined product category |
For comparisons, preserve the original year, geography, currency, channel, category definition and measurement type. A global market forecast should not be compared directly with a national retail dataset, and a self-reported diet figure should not be treated as a household purchasing rate.
Frequently Asked Questions – Plant-Based Food Market
1. What is the current global size of the plant-based food market?
Global retail sales of plant-based foods reached $28.6 billion in 2024, a 5% increase vs 2023, according to analysis of The Good Food Institute’s State of the Industry data by The Food Institute and Green Queen. Earlier GFI/Euromonitor data placed global sales at $29 billion in 2023 and $21.6 billion in 2019, showing strong multi-year growth.
2. How fast is the vegan food market expected to grow through 2035?
Published forecasts generally show high single-digit to low double-digit annual growth. For example, IMARC Group projects about $40–$42 billion by 2032–2033, Research and Markets forecasts $46.09 billion by 2033, and Meticulous Research expects $109.4 billion by 2032. Other reports from SkyQuest and Straits Research land between these ranges.
3. Which regions lead the plant-based food market?
The Good Food Institute’s Euromonitor-based analysis shows Asia-Pacific as the largest region for plant-based milk, with more than twice the plant-based milk sales of North America in recent years (GFI 2023 State of the Industry). Europe and North America are leading regions for plant-based meat, seafood, yogurt, cheese, and ice cream. In Europe specifically, plant-based food and drink across key countries reached about €16.3 billion and 2.4% of FMCG sales, according to Circana.
4. How common is a vegan diet, and how does that compare with plant-based product penetration?
Self-reported vegan diet prevalence is usually in the low single digits, with Statista and the Vegan Society (via Green Queen) reporting 2–4% vegan in markets like Germany, the US, UK, Brazil, China, and Mexico, and around 3% in Canada, Australia, and New Zealand. India stands out with roughly 10–14% vegan and 26% vegetarian in some surveys. In contrast, household penetration for plant-based products is far higher: about 60% of U.S. households bought plant-based foods in 2023, and 37% of German and 33% of UK households bought plant-based meat at least once (GFI Europe).
5. How much more expensive are plant-based products than conventional ones?
GFI’s 2023 pricing analysis shows substantial average U.S. retail price premiums: plant-based meat and seafood are about 77% more expensive than conventional meat, plant-based milk about 104% more expensive, and plant-based eggs about 317% more expensive (GFI 2023 State of the Industry). These are category averages, so actual premiums vary by brand, product, and channel.
6. What share of U.S. online food sales is plant-based?
Plant-based foods over-index in ecommerce compared with grocery. In 2023, U.S. plant-based ecommerce sales were about $394 million, representing 6.8% of online food sales versus 3.8% of brick-and-mortar grocery food sales, based on data from the Plant Based Foods Association Marketplace and NielsenIQ. Total U.S. retail plant-based food sales were roughly $8.1 billion, with 79% cumulative dollar-sales growth between 2018 and 2023.
7. What are the main barriers and motivations for plant-based meat adoption?
U.S. survey data from GFI show that many trial users do not become frequent buyers: among people who tried plant-based meat only once, 51% didn’t like the taste, 44% preferred animal meat, 34% disliked the texture, and 21% considered it too expensive (GFI 2023 State of the Industry). Among repeat consumers, key motivations include health (37% say it’s healthy; 21% cite protein), taste and texture (23% like the taste; 19% like the texture), and ethical/environmental reasons (19% mention avoiding animal harm and 19% cite environmental benefits.