
Green Web Hosting Statistics 2026
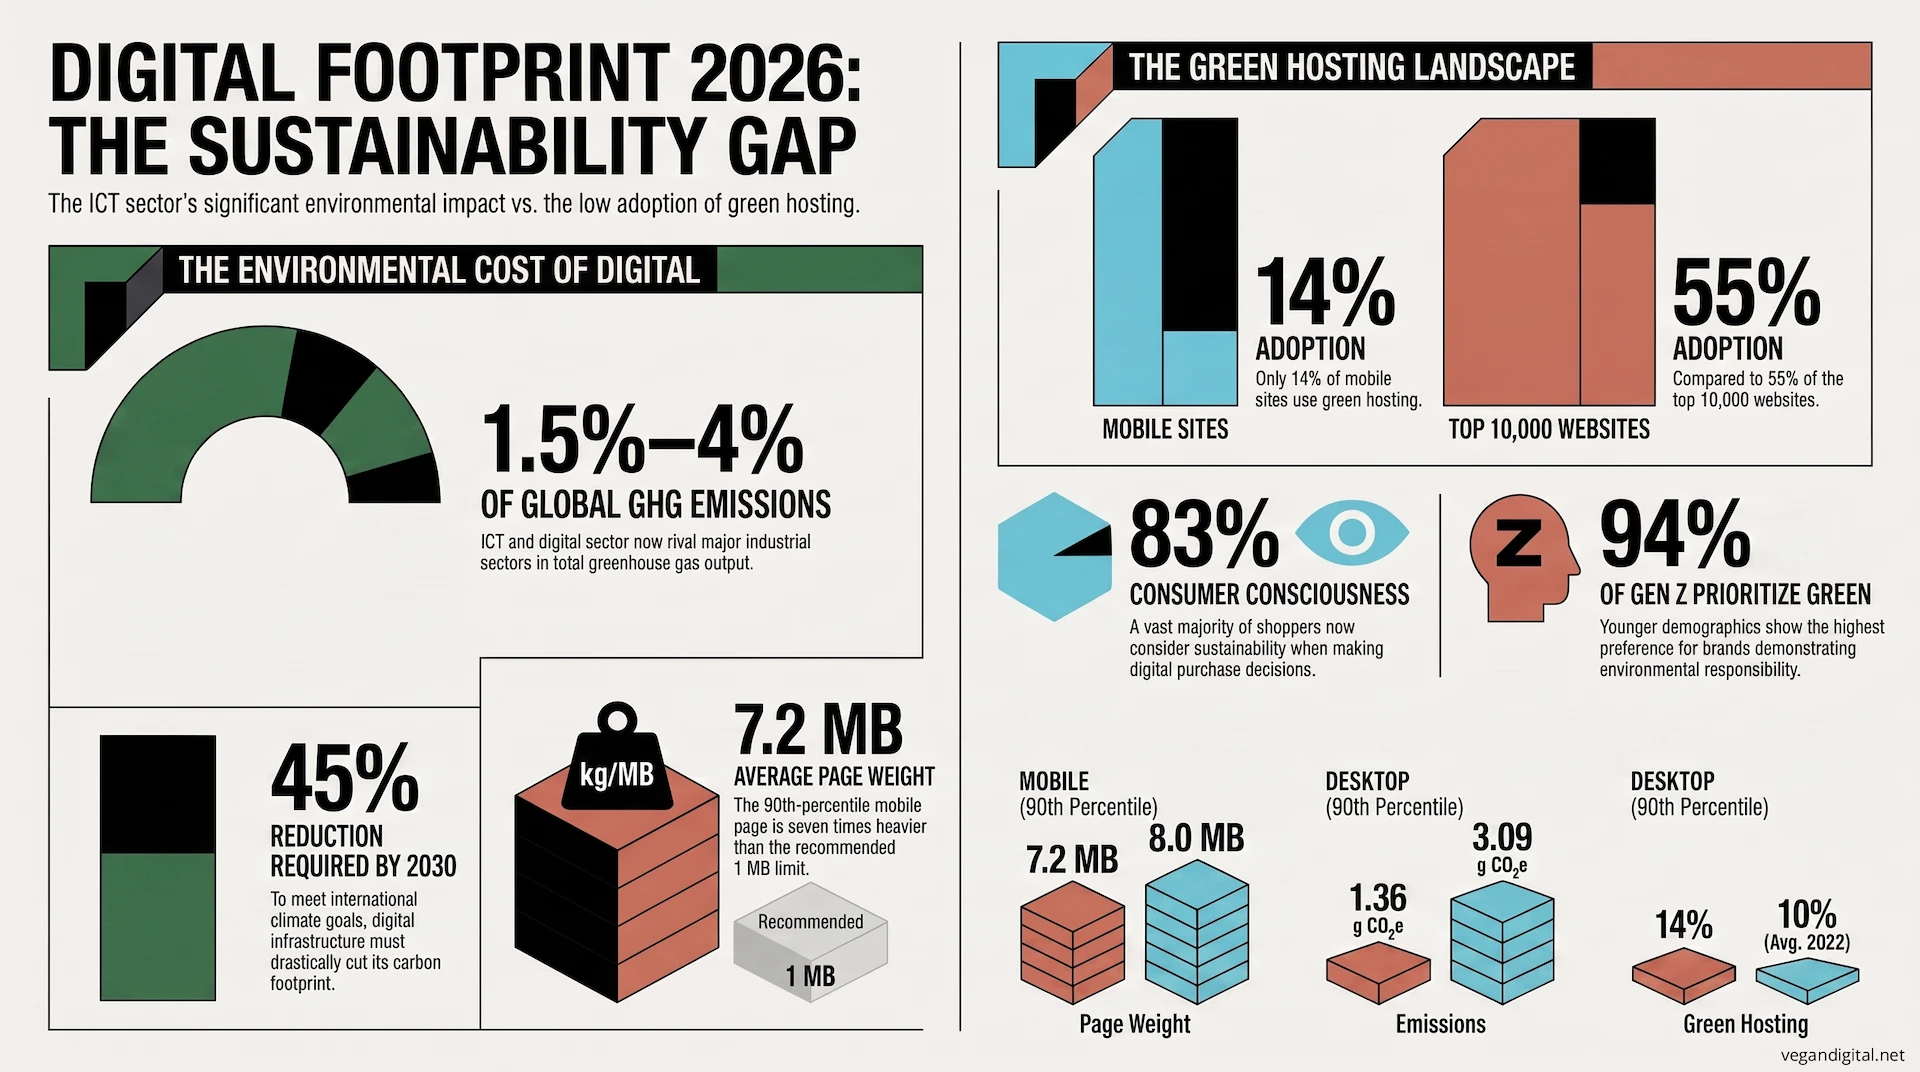
The ICT sector produces approximately 1.5%–4% of global GHG emissions. Only 14% of mobile websites use green hosting, while 90th-percentile mobile pages emit approximately 1.36 g CO₂e per pageview.
Quick Answer
- 1.5%–4%: ICT and digital-sector share of global GHG emissions, according to Measuring the Emissions and Energy Footprint of the ICT Sector, 2024.
- 14%: Mobile websites using green hosting, according to the Web Almanac 2024 Sustainability Chapter.
- 7.2 MB: 90th-percentile mobile page weight. The desktop equivalent is 8 MB, according to the Web Almanac 2024 Sustainability Chapter.
Global ICT and Data-Center Emissions
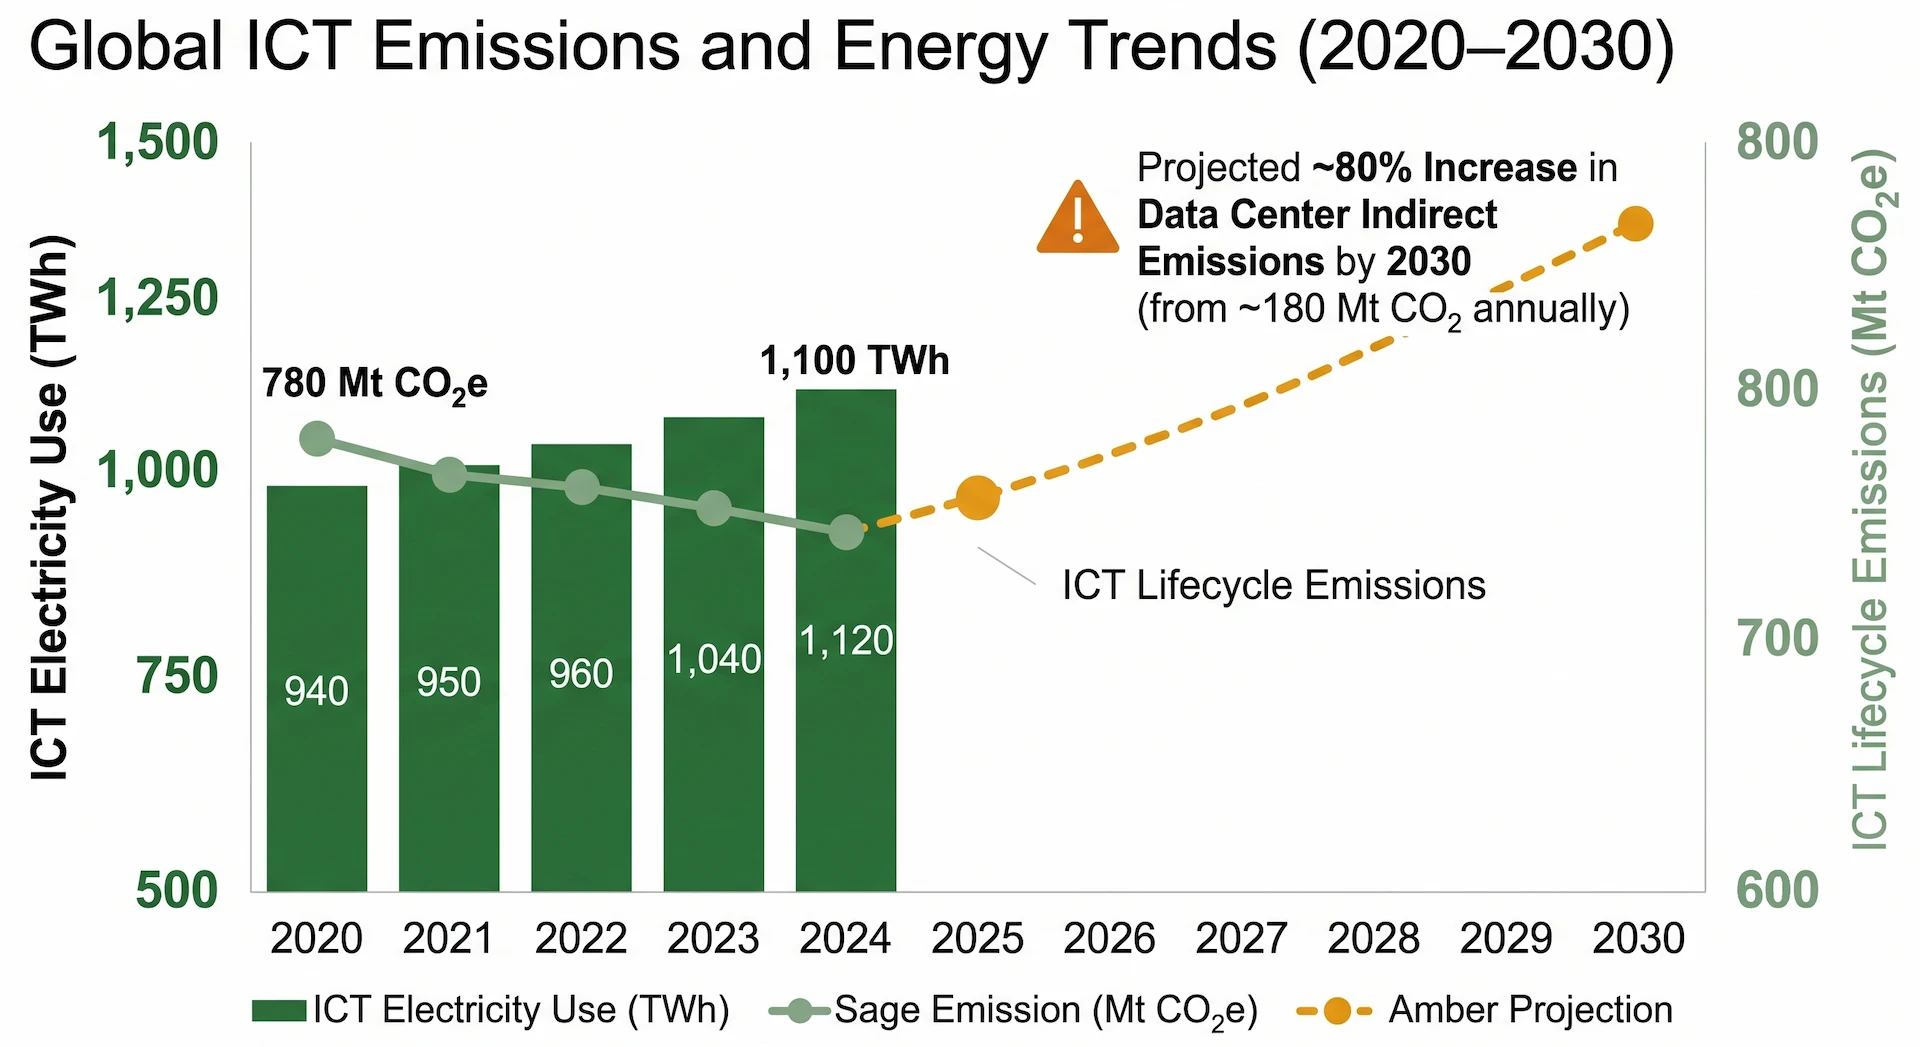
Digital infrastructure consumes approximately 1,100 TWh of electricity annually and data centers produce approximately 180 Mt of indirect CO₂ emissions per year.
| Metric | Statistic | Named source |
|---|---|---|
| ICT and digital-sector emissions | 1.5%–4% of global GHG emissions | ITU, 2024 |
| Required ICT reduction | 45% by 2030 | ITU, 2024 |
| ICT electricity use | 940 TWh in 2020, nearly 1,100 TWh in 2024 | Ericsson, 2025 |
| ICT electricity share | Approximately 4% globally | Ericsson, 2025 |
| ICT lifecycle emissions | 780 Mt CO₂e in 2020, approximately 750 Mt in 2024 | Ericsson, 2025 |
| Data-center indirect emissions | Approximately 180 Mt CO₂ annually | IEA, 2024 |
| Data-center projection | Almost 80% higher by 2030, base case | IEA, 2024 |
| Lift-Off projection | Up to 2.5×, approximately 1.4% of global combustion emissions | IEA, 2024 |
| Leading digital companies | 0.8% of global energy-related emissions, 581 TWh, or 2.1% of global electricity use | ITU and WBA, 2025 |
| Digital-world footprint | 4% of primary energy and GHG emissions, 5.5% of electricity, 0.2% of water use | Web Almanac 2022 |
Website Carbon and Performance
Page weight and resource composition materially affect estimated emissions, with images accounting for more than half of 90th-percentile page weight.
| Website metric | Mobile | Desktop | Named source |
|---|---|---|---|
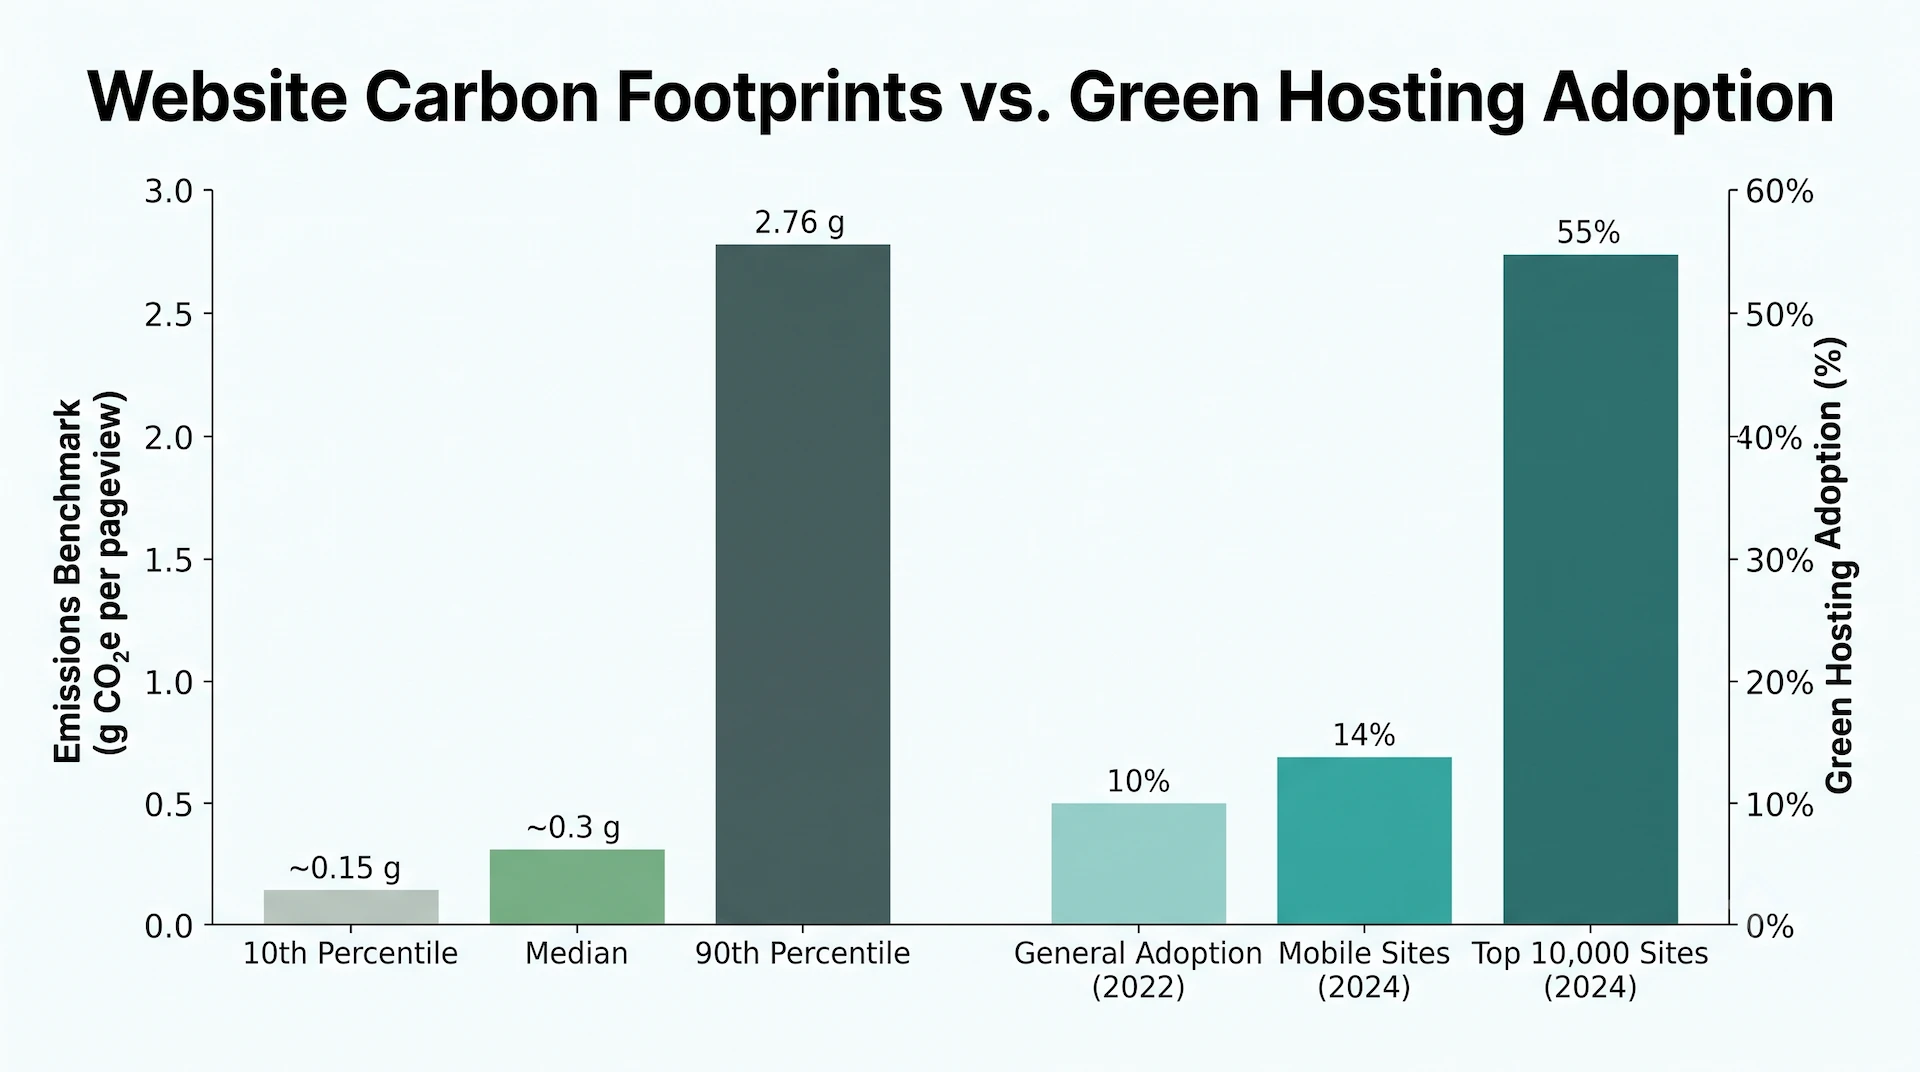
| Average median emissions | Approximately 0.3 g CO₂e per visit | Approximately 0.3 g | Web Almanac 2024 |
| 10th-percentile emissions | Approximately 0.15 g CO₂e | Not reported | Web Almanac 2022 |
| 90th-percentile emissions | 2.76 g CO₂e per pageview | 3.09 g | Web Almanac 2022 |
| 90th-percentile emissions | 1.36 g CO₂e per pageview | Not reported | Web Almanac 2025 |
| 90th-percentile page weight | 7.2 MB | 8 MB | Web Almanac 2024 |
| Recommended page weight | ≤1 MB, ideally approximately 500 kB | Same | Web Almanac 2024 |
More than 13,000%: Increase in average emissions per pageview across analyzed COP host-country websites between COP1 in 1995 and COP30 in 2025. The study also reported 0.14 kg CO₂e at COP3 in 1997 and 116.85 kg CO₂e at COP29 in 2024. PLOS Climate, 2025
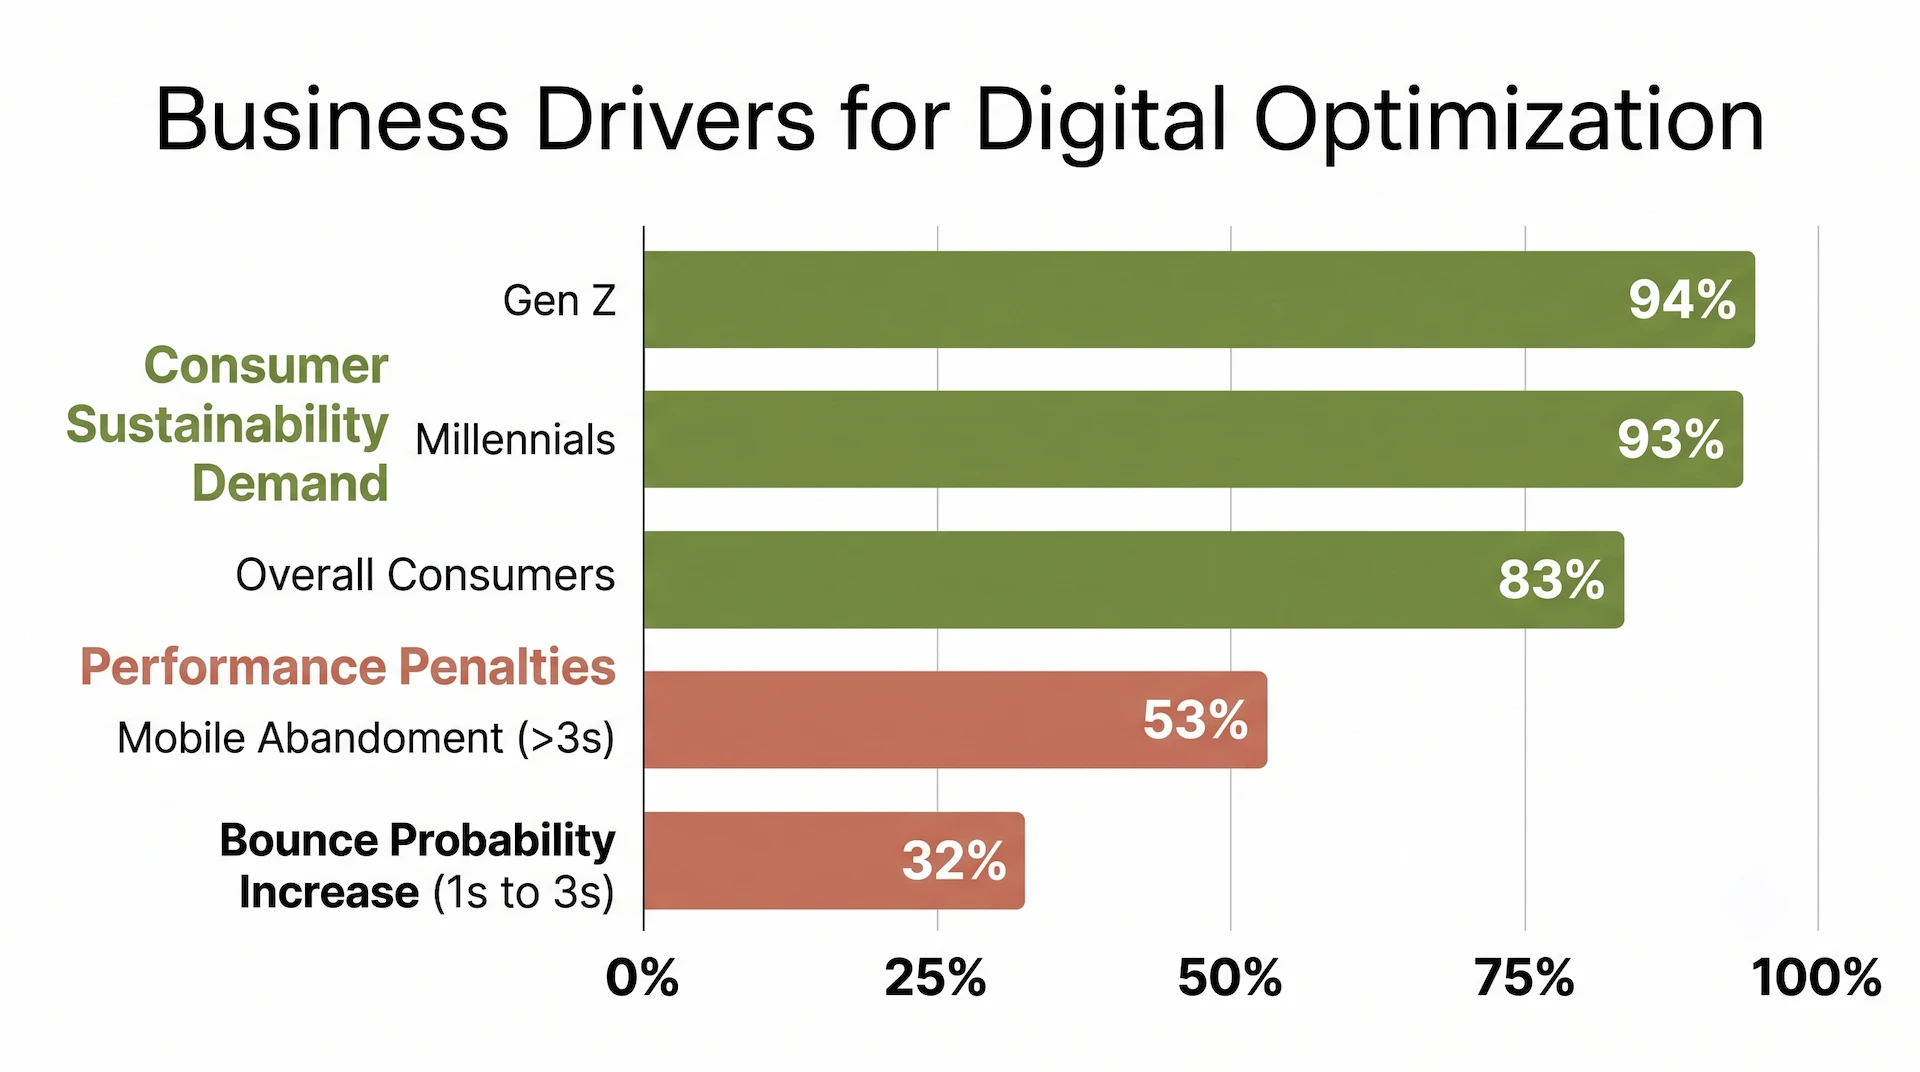
Page-load research reports a 32% increase in bounce probability when load time rises from one to three seconds, approximately 7% lower conversion per additional second, and 53% mobile abandonment beyond three seconds. Cited case studies include 15% more Vodafone leads and a 53% Rakuten revenue uplift. Edmonds Commerce, 2025
Green Hosting Adoption
Green hosting remains uncommon across the wider web, with substantially higher adoption among the top 10,000 websites.
| Metric | Statistic | Named source |
|---|---|---|
| Green-hosted websites | Approximately 10% in 2022 | Web Almanac 2022 |
| Green-hosted mobile sites | 14% in 2024 | Web Almanac 2024 |
| Green-hosted top 10,000 sites | 55% in 2024, up from 48% in 2022 | Web Almanac 2024 |
| Mobile sites without caching | 25% in 2025 | Web Almanac 2025 |
| Domains remaining green for one year | 52.5% in 2021, 80% in 2022, 64% in 2023, 68% in 2024 | University of Twente, 2025 |
| Hosting stability score | Approximately 9.25–9.7 out of 10 | University of Twente, 2025 |
| Five-provider share of Tranco top-10K index pages | Approximately 62% | University of Twente, 2025 |
| Leading firms using 100% renewable electricity | 23 of 200 | ITU and WBA, 2025 |
| Firms with net-zero commitments | 92 of 200, or 46% | ITU and WBA, 2025 |
Consumer Sustainability and E-Commerce
Sustainability influences reported purchase decisions, while price, delivery costs, and unclear labeling remain constraints.
| Consumer metric | Statistic | Named source |
|---|---|---|
| Sustainability considered when purchasing | 83% overall, 91% cross-border shoppers | ESW, 2023 |
| Gen Z and Millennials considering sustainability | 94% and 93% | ESW, 2023 |
| Willing to pay a premium | Approximately 80% | PwC, 2023 |
| Worried about climate change | 64% | Euromonitor, 2023 |
| Price and unclear labeling as barriers | 41% and 28% | Euromonitor, 2023 |
| Willing to pay more for sustainable packaging | 74% | Asendia, 2023 |
Methodology and Limitations
CO₂, CO₂e, electricity, pageview, lifecycle, hosting, and survey statistics use different boundaries and methodologies. Website estimates vary with page weight, caching, visitor location, grid intensity, device energy, network efficiency, and data-center assumptions.
Green hosting classifications may reflect renewable electricity or matched green-energy consumption. Hosting does not eliminate emissions from data transfer, networks, user devices, page production, or website resources.